Grouping Reports
This guide demonstrates how to configure data grouping in Fast Designer. Grouping allows you to organize report data rows into distinct collections based on a specific criteria, such as categorizing customers by their respective countries.
Step 1: Database Connection and Table Setup
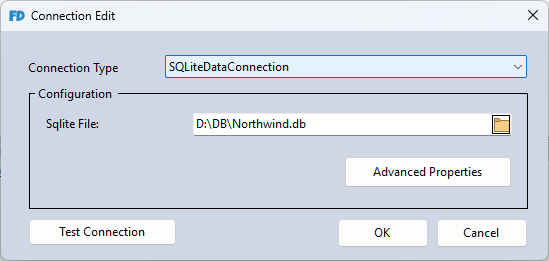
- Create a new report template and establish a new data connection.
- Choose SQLite as your database provider.
- Download the following database archive, extract it, and select the file: Northwind.db.
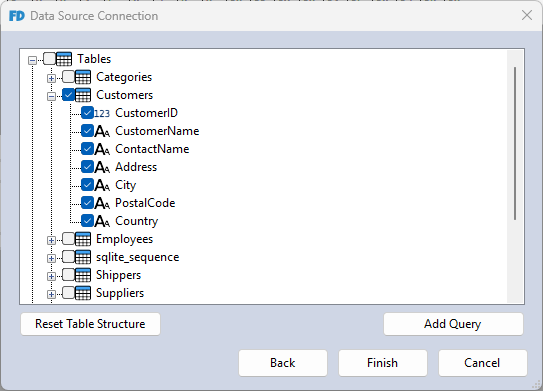
- In the database schema explorer, check the Customers table to include it in your report dataset.
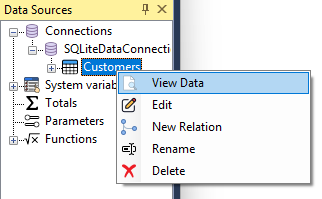
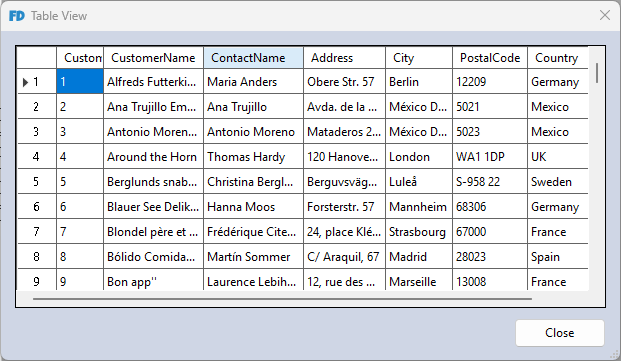
- To inspect the records within your dataset, right-click the Customers table in the Data Sources window and select View Data.
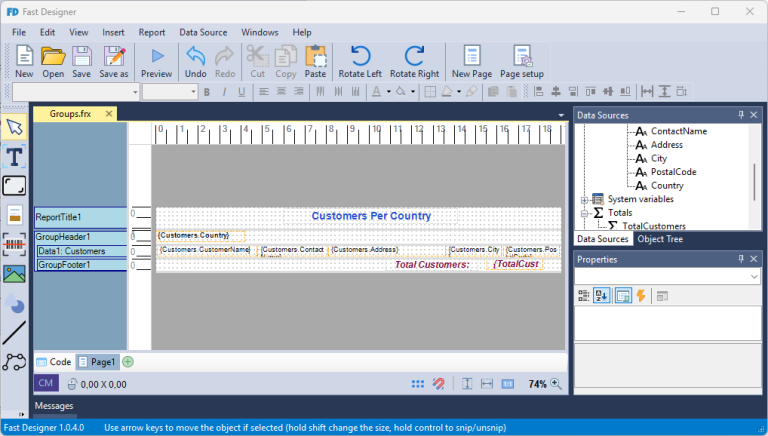
Step 2: Add and Configure Report Group Bands
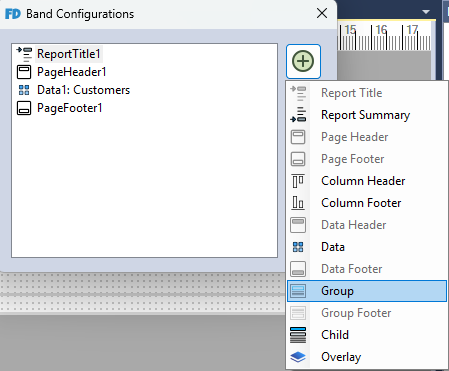
- Navigate to the Main Menu, select Report, and click Configure Bands (or use the shortcut
Ctrl + B). - Within the band configuration utility, click Add and select Group. This action generates a
GroupHeader1and a correspondingGroupFooter1around your layout's data band.
- Drag and drop the following data columns into the Data band workspace:
CustomerName,ContactName,Address,City, andPostalCode. - Drag and drop the Country column into the GroupHeader1 band workspace.
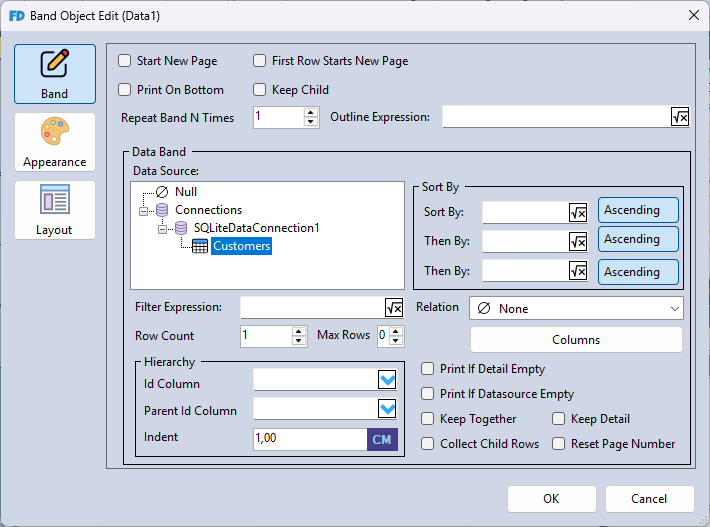
- By default, Fast Designer assigns the
Customerstable as the active active data source for the workspace. You can verify this linkage by right-clicking an empty section of the Data band and choosing Edit. Ensure that the Data Source property field is explicitly set toCustomers.
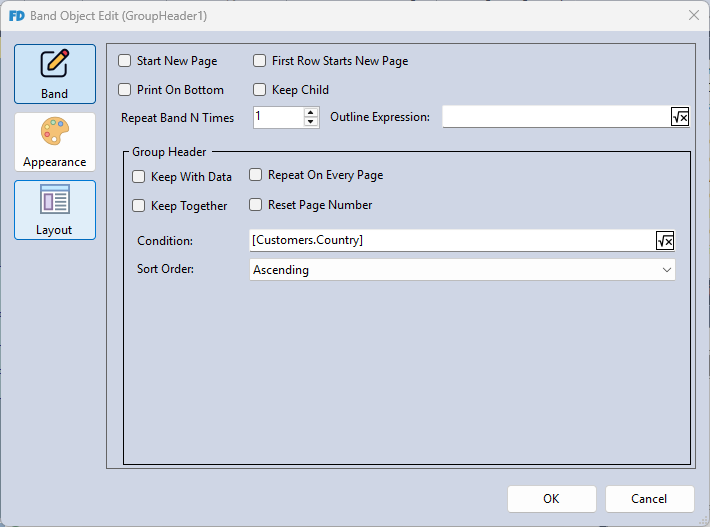
- Right-click the GroupHeader1 band title and select Edit.
- Define the grouping logic by setting the Condition expression field to:
[Customers.Country].
Step 3: Create Totals and Aggregations
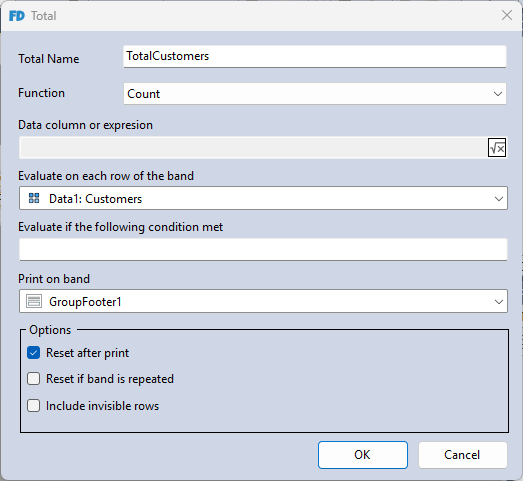
To compute summary numbers for each individual grouping (e.g., counting the total number of customers within each country), implement an aggregate function:
- Create a new Total instance via the data window.
- Set the aggregation Function property to Count.
- Direct the engine to evaluate values line-by-line by setting Evaluate on each row of the band to
Data1: Customers. - Control target visibility by setting the Print on band property to
GroupFooter1, then click OK to save.
- Drag and drop your newly generated Total object from the data catalog directly onto the GroupFooter1 band area.
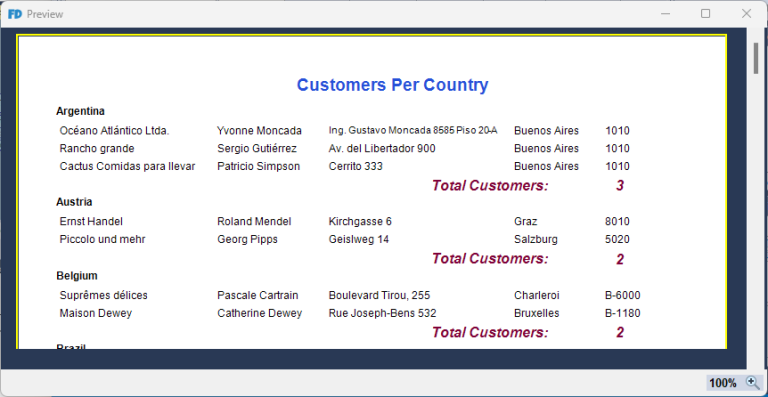
Step 4: Preview Layout Outcomes
Press F5 (or select Preview from the workspace options) to compile and render your grouped dataset layout.
Download Completed Example