Master-Detail Reports
This guide provides a step-by-step walkthrough for creating a master-detail report in Fast Designer using a sample database. Master-detail reports allow you to display hierarchical data, such as an order (master) paired with its corresponding line items (detail).
Step 1: Database Connection and Table Selection
- Create a new report and establish a new data connection.
- Select SQLite as your database provider.
- Download the sample database file, unzip it, and select it: Northwind.db.
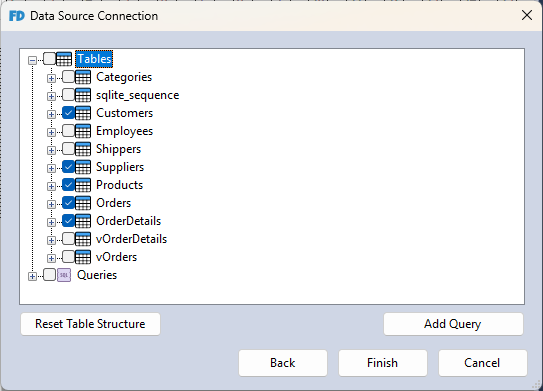
- Add the required tables to your data source.
Step 2: Establish Table Relations
To link hierarchical data correctly, you must define relations between the tables.
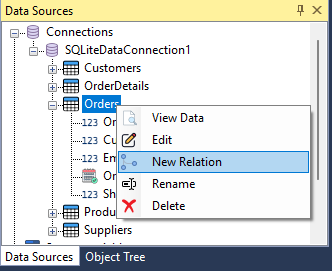
- In the Data Sources window, right-click the target table and select New Relation.
- Configure the relationship properties in the relation editor window. For example, when linking the
Orderstable to theOrderDetailstable, setOrderDetailsas the parent table and map theOrderIDcolumn from both tables as the linking key.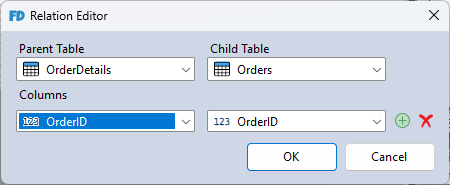
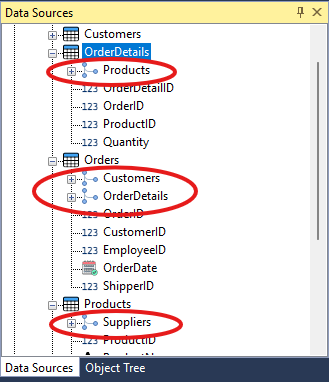
Required Document Relations
Configure all table relations according to the following structure:
- OrderDetails Table
- Linked to Products via
ProductID
- Linked to Products via
- Orders Table
- Linked to Customers via
CustomerID - Linked to OrderDetails via
OrderID
- Linked to Customers via
- Products Table
- Linked to Suppliers via
SupplierID
- Linked to Suppliers via
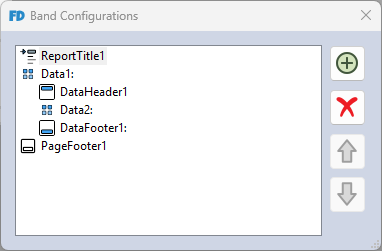
Step 3: Configure Report Bands
- Navigate to the Main Menu, select Report, and click Configure Bands (or use the shortcut
Ctrl + B). - Arrange and nest the report bands using the structure shown below:
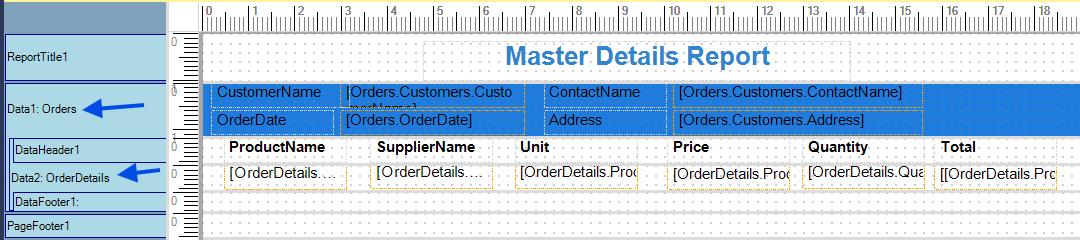
- Drag and drop the data columns from the
Orderstable into the Data1 band, and the columns from theOrderDetailstable into the Data2 band. - By default, dragging a column onto an empty data band automatically binds that band to the corresponding table. You can verify that a data band is correctly linked by checking its Band Label in the workspace.
Step 4: Add Filter Parameters
To restrict report data to a specific time frame based on the Orders.OrderDate column, you need to implement report parameters.
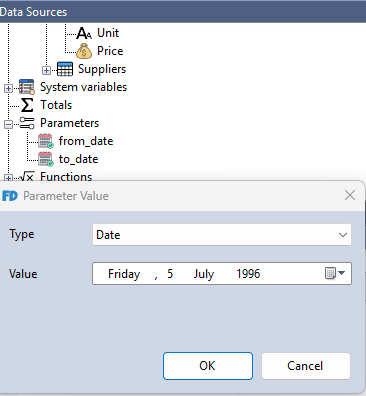
- In the Data Sources window, right-click Parameters and select New Parameter.
- Create two parameters:
date_fromanddate_to. Right-click each parameter to rename it correctly. - Double-click each parameter to assign a default test value. Set
from_dateto1996-07-05andto_dateto1996-07-10.noteThese values serve as defaults and can be modified at runtime before the report is generated.
Step 5: Apply Filter Expressions and Row Constraints
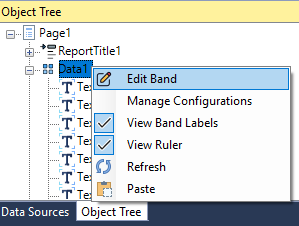
- In the Object Tree window, right-click the Data1 band and select Edit Band.
- Click the Expression Icon next to the Filter Expression field to open the editor.
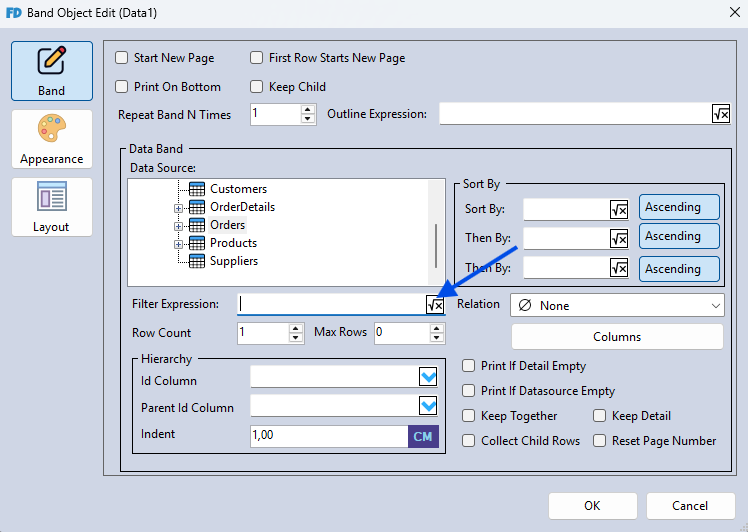
- Enter the following logical filter expression:
[Orders.OrderDate] >= [from_date] && [Orders.OrderDate] <= [to_date]
-
Click OK to close the expression editor, then click OK again to save and apply your changes.
-
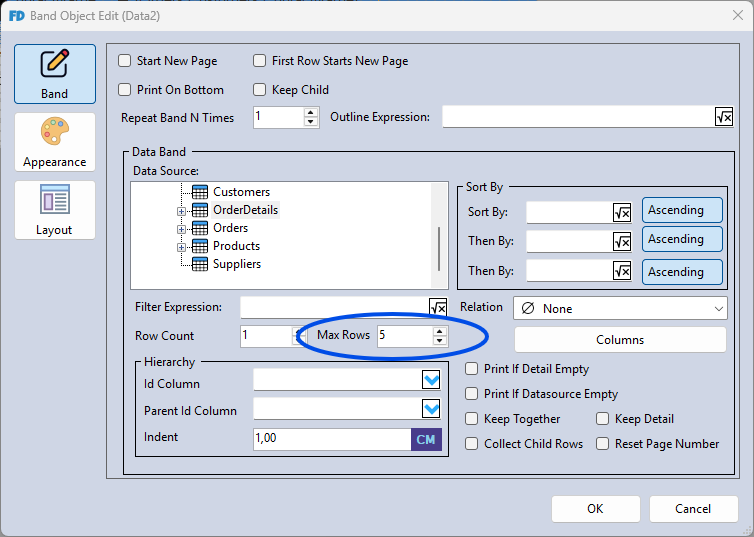
For testing purposes in this demonstration, you can also edit the Data2 band and limit data retrieval by setting the Max rows property to
5.
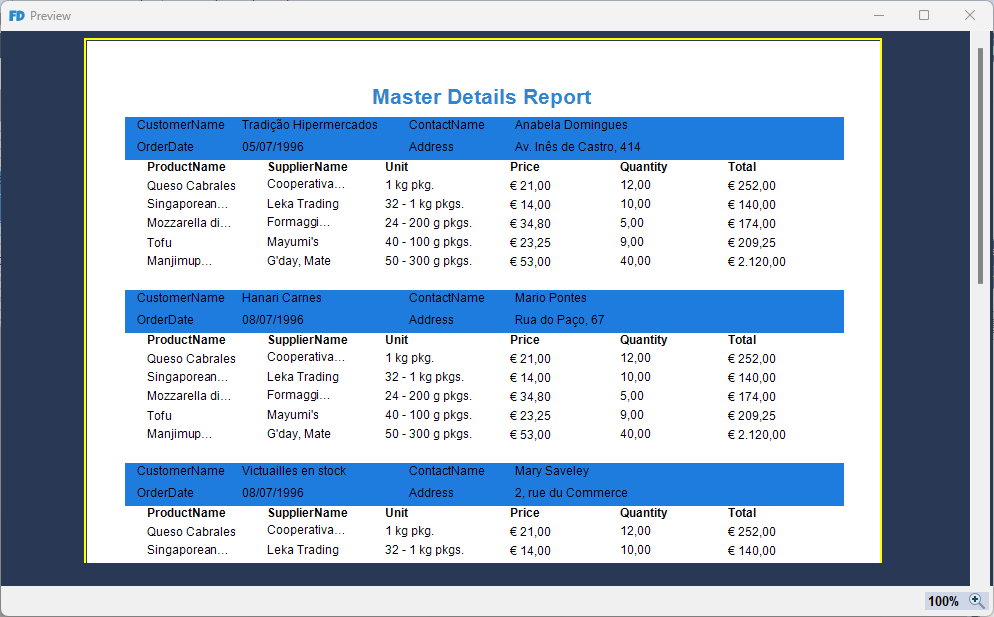
Step 6: Preview and Download
Press F5 (or click Preview) to review the compiled layout and verify the data mapping outputs.