Simple List Report
This guide provides a step-by-step walkthrough for building a fundamental list report in Fast Designer. You will learn how to configure a local JSON data source, map fields to layout bands, format data expressions, and implement basic summary calculations.
Step 1: Initialize an Empty Report
- Launch Fast Designer.
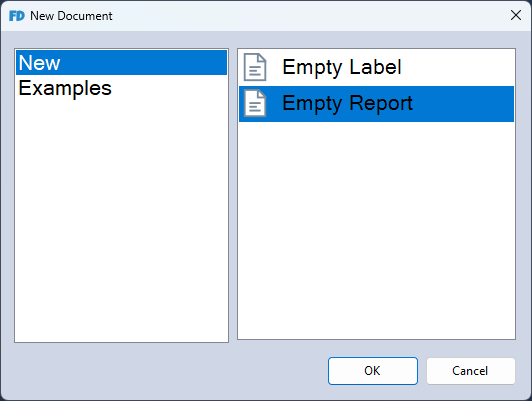
- Click New from the file menu (or press
Ctrl + N). - Select Empty Report from the template gallery to establish a blank workspace.
Step 2: Establish a JSON Data Connection
- Navigate to the data configuration options: Data Source ➜ Manage Data Source (or press
Ctrl + M). - Click New and select New Connection from the drop-down menu.

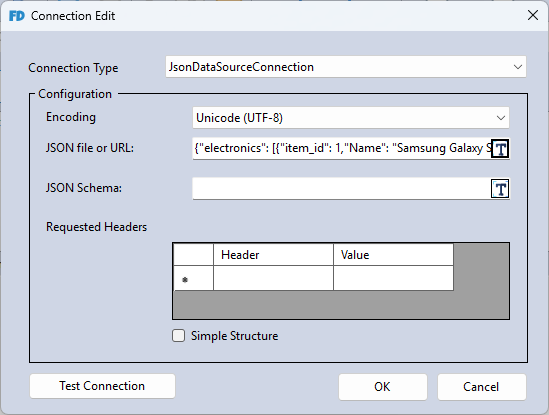
- Choose JSON as the connection provider type.
- Input your dataset schema into the configuration text editor using the following structural format:
{
  "electronics": [
    {
      "item_id": 1,
      "Name": "Samsung Galaxy S24",
      "Category": "Smartphone",
      "manufacture_date": "2025-01-15",
      "quantity": 50,
      "price": 899.99
    },
    {
      "item_id": 2,
      "Name": "Apple MacBook Air M3",
      "Category": "Laptop",
      "manufacture_date": "2025-02-10",
      "quantity": 25,
      "price": 1299.0
    }
  ]
}
- Click OK, then click Next to review your structural data entities.
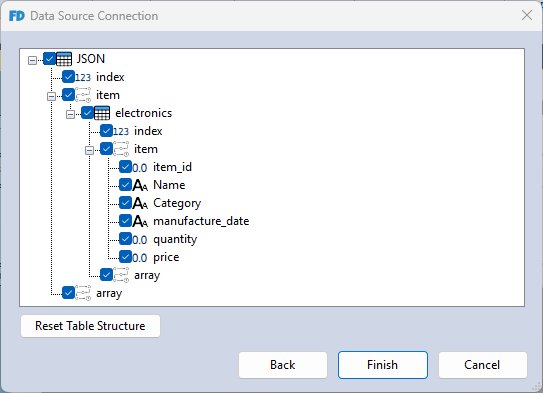
- Click Finish to populate your active workspace fields.
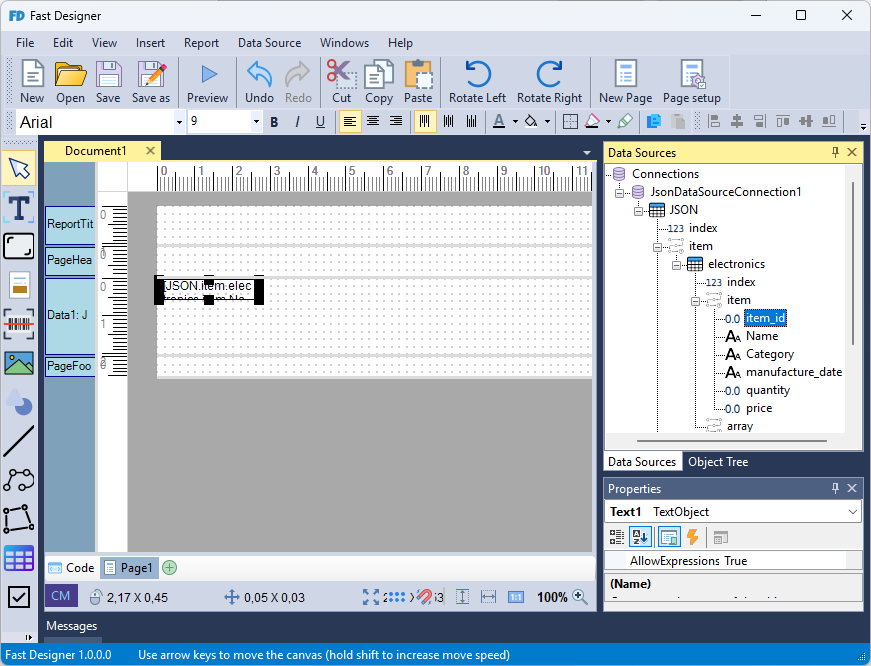
Step 3: Populate Layout Data Bands
Once the connection is established, the Data Sources Window updates with your newly defined database collections.
-
Locate the
electronicsentity block in the data explorer tree. -
Drag and drop the Name data field from the schema tree directly onto the active Data1 workspace band row.
-
Repeat this process for the remaining entity fields:
Category,manufacture_date,quantity, andprice.
Step 4: Configure Page Header Columns
To provide context for your row values, add text labels into the structural page headers.
-
Select Text Object from the left toolbar, or go to Main Menu ➜ Insert ➜ Text.
-
Insert the component inside the PageHeader band area.
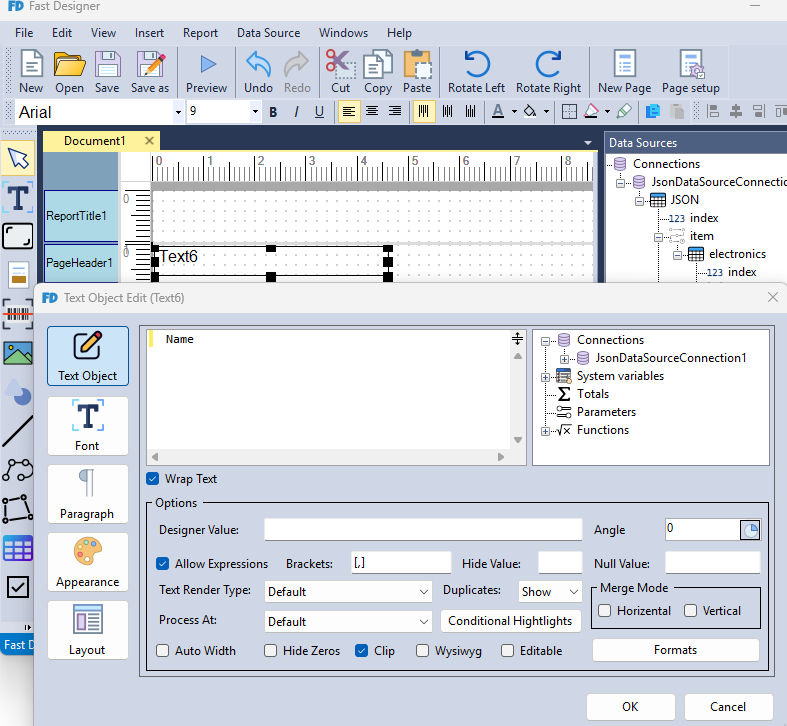
-
Double-click the new element (or right-click and select Edit) to open the text modification canvas.
-
Input the desired display name for the column header.
-
Create and place individual header labels for all corresponding data.
Step 5: Assign Component Formatting
Ensure that variable values render cleanly by declaring explicit data types.
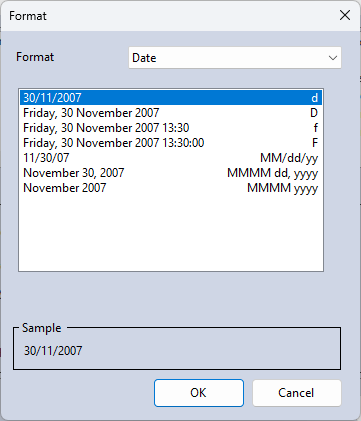
-
Right-click the variable component mapped to
manufacture_dateinside the Data1 band. -
Select Formats (or double-click to open properties, then click Formats).
-
Set the target conversion category rules to Date.
-
Repeat these actions for the numeric variables, applying appropriate Currency formats for
Priceand Integer properties forQuantity.
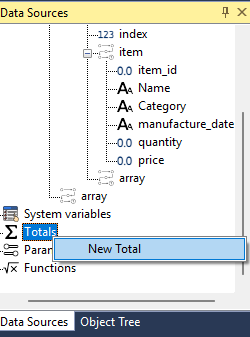
Step 6: Implement Aggregate Summary Calculations
To track inventory totals, create an aggregation formula to compute overall quantities.
-
In the Data Source explorer window, right-click Totals and select New Total.
-
Define a unique identifier name for the expression.
-
Set your target evaluation metric by mapping the
quantityattribute into the Data Column field.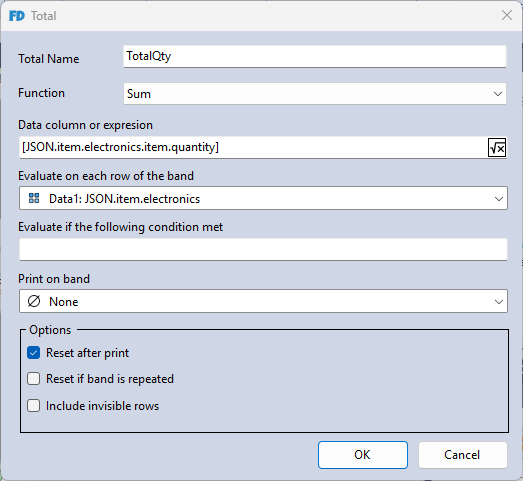 tip
tipYou can easily assign this target by opening the formula wizard and dragging the column directly from the data source hierarchy tree.
-
Click OK to register the summary field.
-
Navigate to Main Menu ➜ Report ➜ Report Summary to append a final totals summary section to your report structure.
-
Drag your newly created aggregation object from the catalog panel and position it within the ReportSummary1 band area.
-
Place an adjacent descriptive label component next to the variable and assign it the string value
"Total Quantity:".
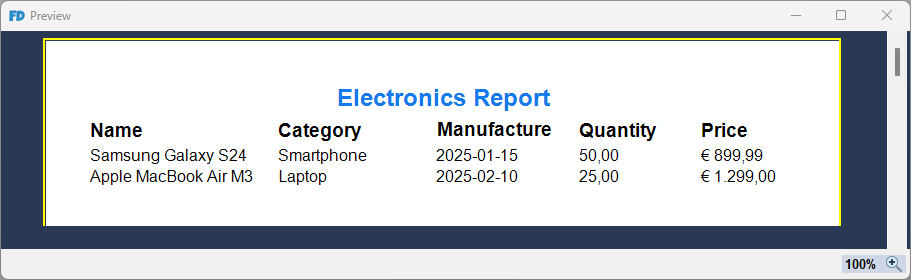
Step 7: Compile and Preview Layouts
Your basic document layout structure is now complete. Click Preview on the main application toolbar (or press F5) to compile your logic and verify data rendering outputs.